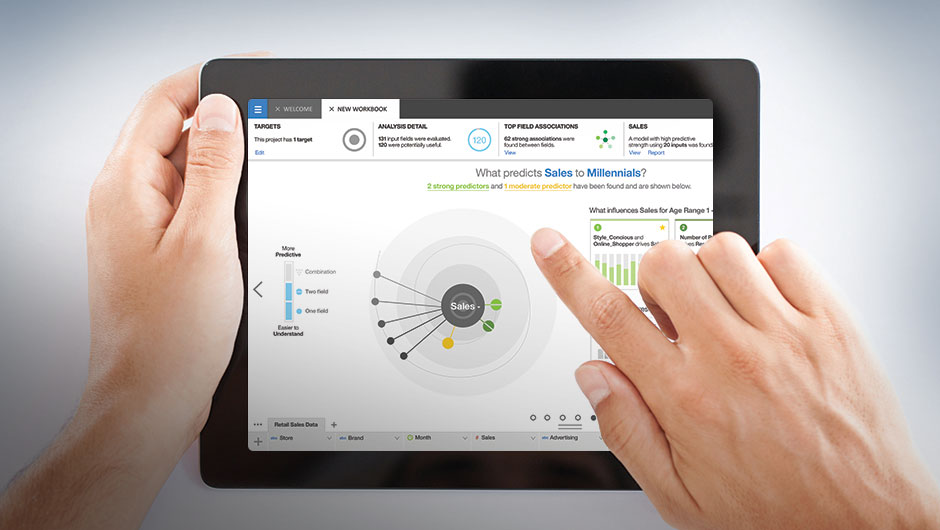
This week I saw a demo of Watson Analytics, IBM’s new natural language-based analytics tool. It was presented at the New York Strategic HR Analytics Meetup, though the tool itself is not specialized to any one business function – and that is a big part of its appeal.
My initial thought was, “Uh oh, there goes the boom in data analyst jobs!” I also felt really excited at the idea of analytics operating like a Google search bar. Number crunching for the masses!
The past few years have been an exciting time to be following data and analytics. With market intelligence startups like Food Genius getting regular mentions in the press and tools like Qlik and Tableau entering the common language of non-data heads in the business, it’s cool to see where analytics is going next.
Here are the top five reasons to get excited about Watson Analytics (and one reason to be weary):
- You’re no longer at the mercy of your IT team.
You can pull in data from Excel spreadsheets, Oracle, Salesforce, etc. The data has to be uploaded to IBM’s cloud in order to use it in Watson, but data selection and clean-up takes place as a step in the analysis. Current solutions on the market try to approach this by doing transfers and loads on their own, but there’s a lot of planning ahead – and partnering with the data managers in IT – required before you can move data into any system for analysis.
- Data clean-up is a cinch.
In the demo, after the rep chose a question, the next page guided clean-up, the process of organizing and formatting the data. IBM estimates that data preparation can take 50-70% of the completion time of a data mining project. To be fair, Excel does this pretty well but has its limits with huge data sets.
- The data looks pretty!
Any analyst worth her salt knows that getting the right data story is only half the battle. No one cares about a pivot table – they want to see cool graphics. Compelling visualizations are the vehicle for getting data into viewers’ heads. The visualizations in the Watson demo look good – they have lots of information without looking too busy, they connect well to the data they’re showing and the colors and shapes are bold and appealing.
- It’s not relegated to a single business function.
There are great analytics tools for marketing, great analytics tools for operations, great (or at this stage, maybe just good?) analytics tools for human resources. The beauty of Watson Analytics is that it doesn’t specialize. I hope movement towards tools like this leads to asking deeper questions of the data, like how do disparate business functions work together and drive productivity, sales, etc.
- Analytics is no longer the domain of analysts.
This tool doesn’t require a PhD to understand a multivariate regression. Analytics and data storytelling are now in the hands of anyone with a question that can be answered with the data on hand.
And my bonus point, one reason to be weary:
- Data analysis is only as good as the people communicating it.
A huge job in building good data stories is communicating the finer points of the analysis to those less data-savvy. A difference of 2% can mean nothing or so much depending on the sample size. A regression is only as good as the variables you’re putting into it. These basic statistical concepts may be lost with easy-access analysis. Data is powerful, and it should be wielded wisely!
Ultimately, I am excited to get my mitts on a trial and signed up at IBM’s site. You can too here.
So what do you think? Is natural language analytics the next big thing? Will we all be data analysts in the near future?
